USD/CAD Price Analysis: Declines towards 1.3100
- USD/CAD looks set for further breakdown as the US Dollar weakens further.
- The underlying inflation in the US economy is clearly in a downtrend.
- Momentum oscillators indicate more downside ahead.
The USD/CAD pair trades back and forth in a narrow range near the round-level support of 1.3200 in the early New York session. The Loonie asset struggles for a direction amid decline in volume due to shortened week.
S&P500 futures added nominal gains in the European session, portraying higher risk-appetite of the market participants. The US Dollar Index (DXY) has printed a fresh five-month low near 101.30 as investors are expecting that the Federal Reserve (Fed) would continue the rate-unwinding program from March.
A sharp decline in the underlying inflation data released on Friday indicates that price pressures are clearly in a downtrend.
The oil price recovers strongly after Russian Deputy PM Alexander Novak said their companies are sticking to their obligations on supply cuts. It is worth noting that Canada is the leading exporter of oil to the United States and higher oil prices support the Canadian Dollar.
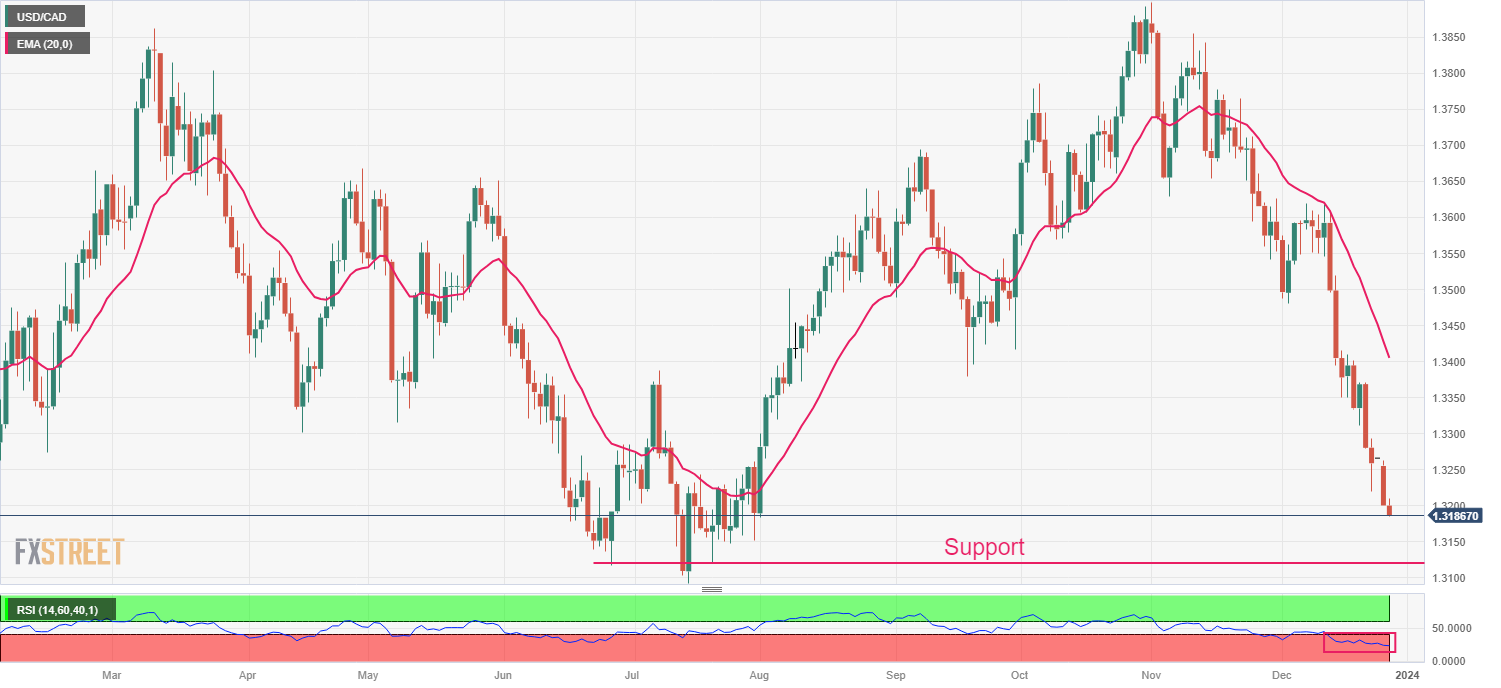
USD/CAD has been falling since the first day of November and is expected to decline further towards June 27 low, which is around 1.3117. Downward-sloping 20-day Exponential Moving Average (EMA) indicates that the near-term trend is bearish.
The Relative Strength Index (RSI) (14) hovers in the bearish range of 20.00-40.00, which indicates downside momentum is intact.
Going forward, a breakdown below intraday low of 1.3180 would expose the asset to July 25 low near 1.3150, followed by July 13 low around 1.3193.
In an alternate scenario, a recovery move above April 14 low around 1.3300 would drive the asset towards December 21 high at 1.3370. A breach of the latter would push the Loonie asset towards May 16 low at 1.3404.
USD/CAD daily chart

