USD/CAD Price Analysis: Remains subdued below 1.3500
- USD/CAD trades sideways below 1.3500, following the footprints of the US Dollar.
- Fed Waller said the central bank should not rush for rate cuts.
- The Canadian Retail Sales for December were more robust than expected.
The USD/CAD pair corrects to near 1.3480 in Friday’s European session after failing to sustain above the psychological resistance of 1.3500. The Loonie asset’s action is driven by the subdued US Dollar. After a strong recovery, the US Dollar Index (DXY) turns sideways as investors want fresh guidance on the Federal Reserve’s (Fed) interest rates.
S&P500 futures remain stagnant in the European session, indicating a quiet market mood. The USD Index hovers near 104.00 despite Fed policymakers reiterating the need for more evidence to gain confidence over inflation declining sustainably to the 2% target.
On Thursday, Fed Governor Christopher Waller said the risk in waiting for good inflation data is less than acting on rate cuts too quick. Waller is interested in observing data for at least a couple of months to confirm whether January’s sticky inflation numbers were a one-time blip or progress in price pressures is stalling.
Meanwhile, the Canadian Dollar fails to capitalize on robust Retail Sales data for December. Monthly Retail Sales grew at a robust pace of 0.9% against expectations of 0.8% and a stagnant performance in November. However, it has increased stubbornness in the inflation outlook.
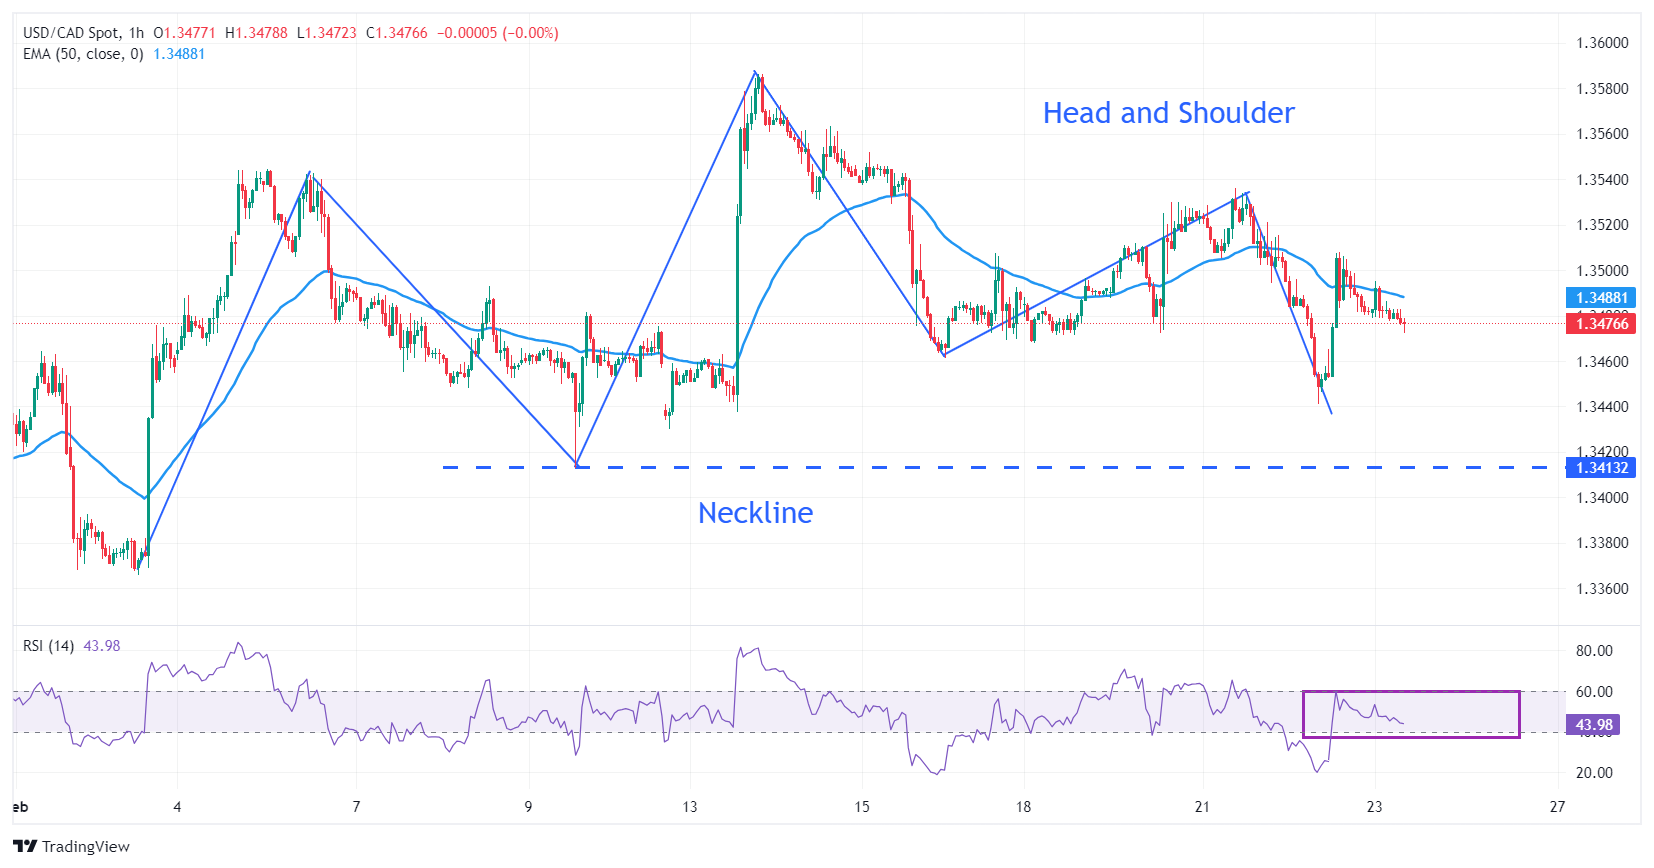
USD/CAD forms a Head and Shoulder chart pattern on an hourly timeframe, which indicates a prolonged consolidation. A breakdown of the neckline plotted from February 9 at 1.3413 will result in a bearish reversal.
The 50-period Exponential Moving Average (EMA) is a significant barricade for the US Dollar bulls. The 14-period Relative Strength Index (RSI) hovers inside 40.00-60.00, which indicates a sideways trend.
A sell-off could appear if the Loonie asset drops below January 31 low at 1.3359. This will expose the asset to January 4 low at 1.3318 and January 5 low at 1.3288.
On the contrary, fresh upside would emerge if the Loonie asset climbs above January 17 high at 1.3542, which will drive asset towards the round-level resistance of 1.3600, followed by November 30 high at 1.3627.
USD/CAD hourly chart