Back
20 Jul 2018
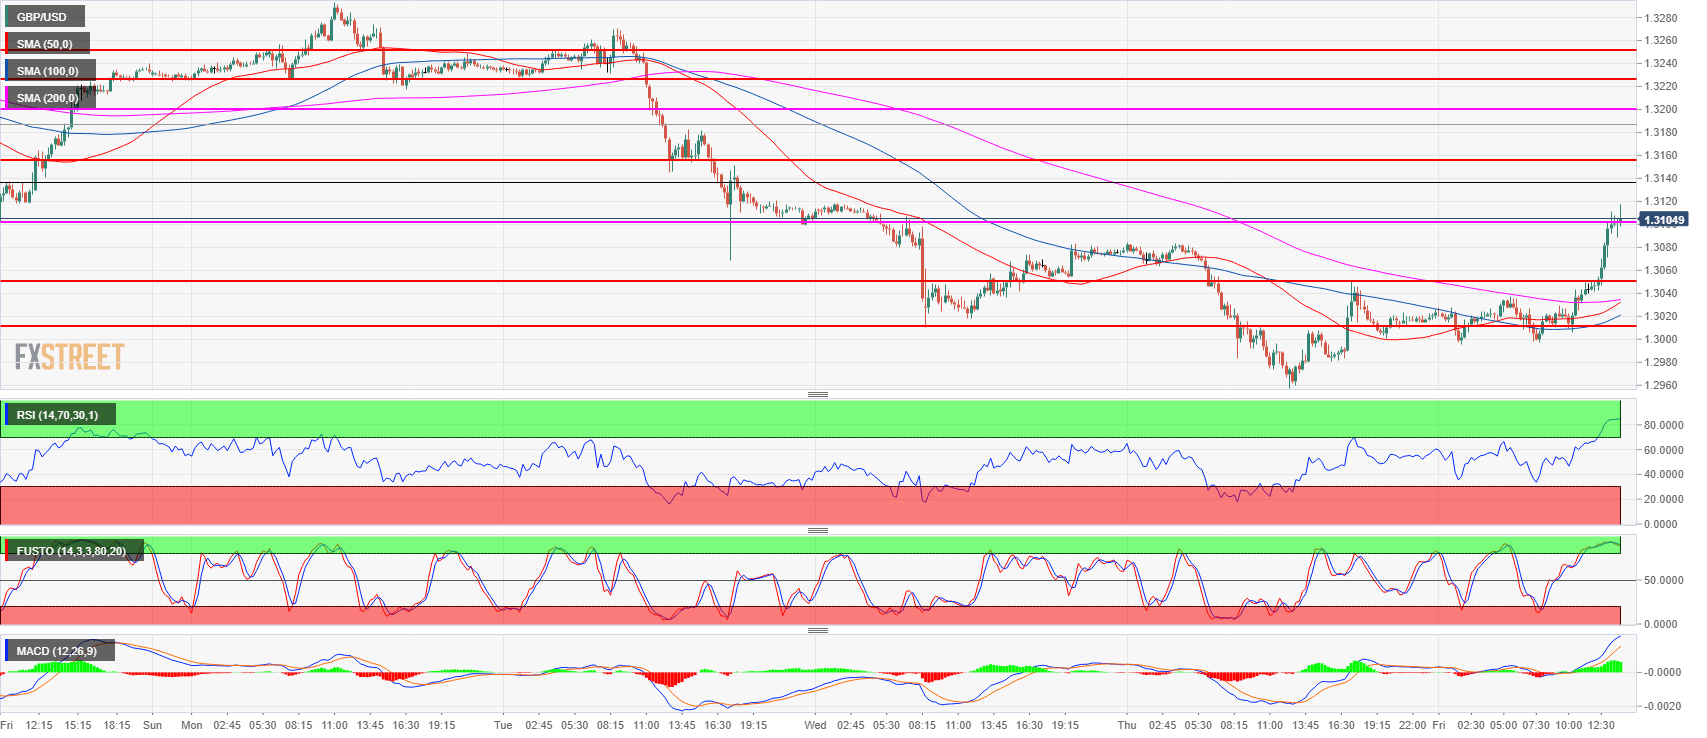
GBP/USD Technical Analysis: King Dollar gets pounded as GBP/USD runs up to 1.3100 figure
- GBP/USD gained about 80 pips this Friday as the bulls managed to break above the 1.3100 level.
- Short-term momentum appears to have switched to bullish as GBP/USD is trading well-above all its main simple moving averages.
- Support is likely located near 1.3049 June 28 low and a bear breakout below the level would be seen as a sign of bullish weakness and a potential resumption of the bear trend.
- Resistances to the upside are seen near 1.3155 and the 1.3200 figure.
GBP/USD 15-minute chart
Spot rate: 1.3103
Relative change: 0.66%
High: 1.3117
Low: 1.2995
Trend: Bearish / Bullish correction
Resistance 1: 1.3100 figure
Resistance 2: 1.3155 former breakout point
Resistance 3: 1.3200 figure
Support 1: 1.3049 June 28 low
Support 2: 1.3010 July 18 low
Support 3: 1.2957 current 2018 low
Support 4: 1.2908 September 5, 2017 low
Support 5: 1.2774 August 24, 2017 low