GBP/USD Technical Analysis: GBP/USD keeps falling and hits a new 2018 low
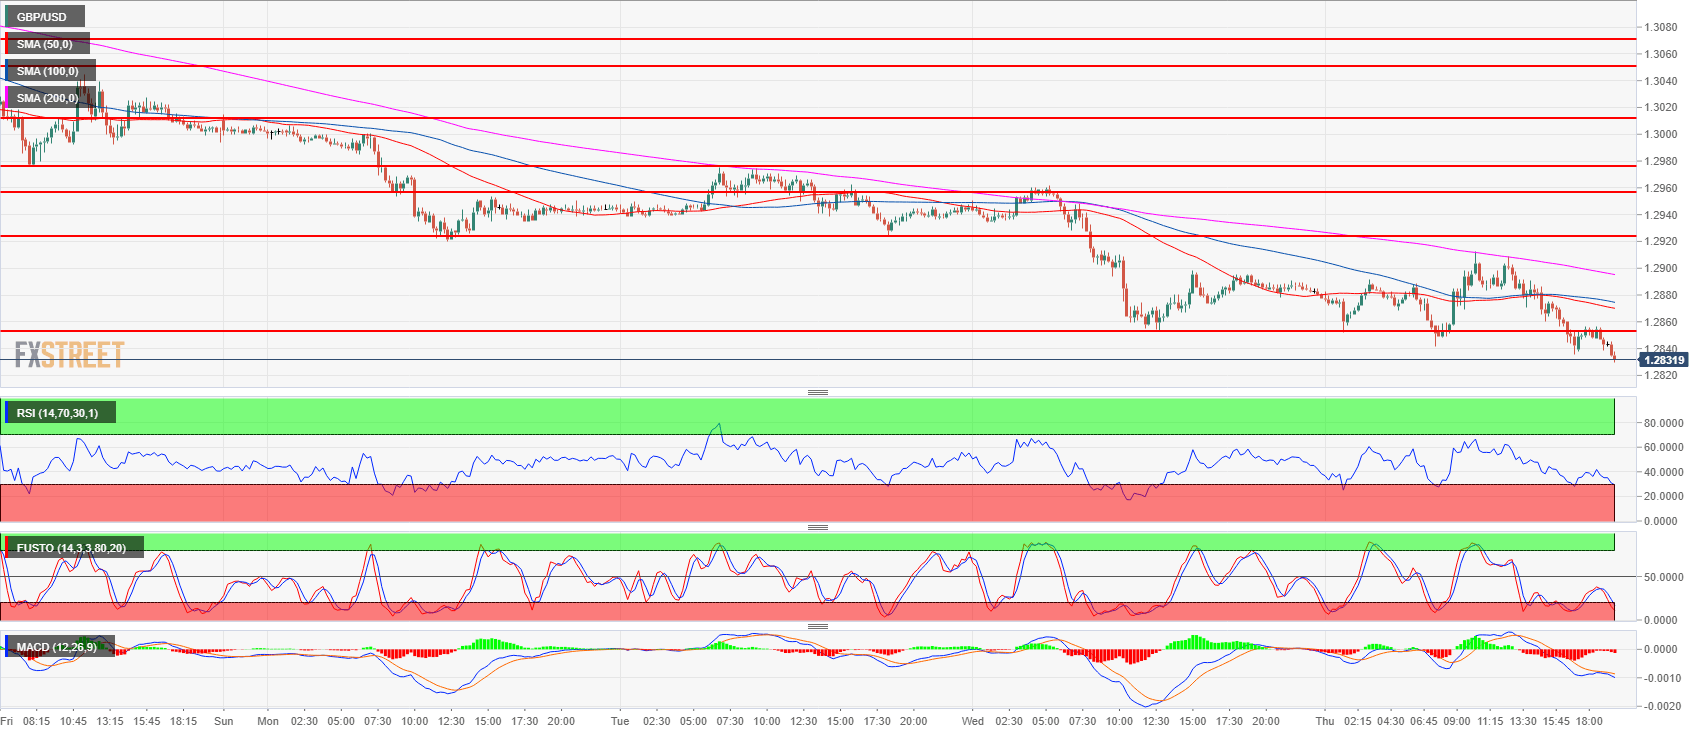
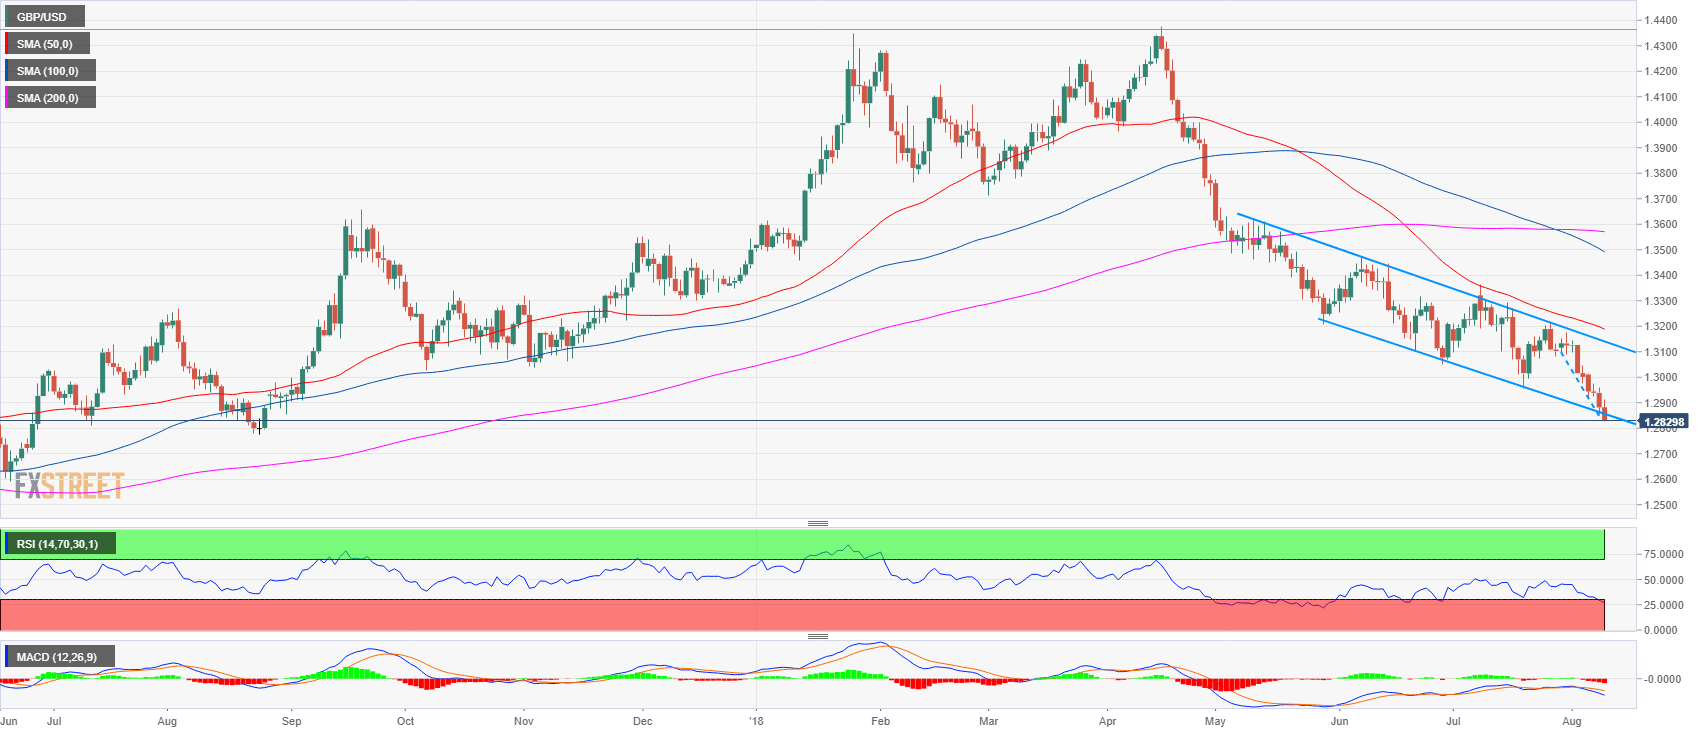
- GBP/USD has reached a new 2018 low at 1.2826 as the bears are pushing Cable into oversold territories and beyond most trendlines on the daily chart. GBP/USD has now exceeded its average daily range of 82 by 4 pips.
- GBP/USD bears next targets are likely located near 1.2774 August 24, 2017 low and 1.2700 figure. Bulls will try to create a reversal by first targeting 1.2900-1.2923 area but it will not be an easy task as they have to face strong bearish pressure.
GBP/USD 15-minute chart
 b
b
GBP/USD daily chart

Spot rate: 1.2828
Relative change: -0.40%
High: 1.2912
Low: 1.2826
Trend: Bearish
Resistance 1: 1.2900-1.2923 area, figure and August 7 low
Resistance 2: 1.2957 July 17 low
Resistance 3: 1.2975 August 3 low
Resistance 4: 1.3000-1.3010 area, figure and July 18 low
Resistance 5: 1.3049 June 28 low
Resistance 6: 1.3100-1.3076 area, figure and July 24 low
Resistance 7: 1.3155 former breakout point
Resistance 8: 1.3200 figure
Resistance 9: 1.3230 supply level
Resistance 10: 1.3250 June 4 high
Support 1: 1.2826 August 9, low (2018 low)
Support 2: 1.2774 August 24, 2017 low
Support 3: 1.2700 figure
