Back
16 Nov 2018
S&P500 Technical Analysis: Inverse Head-and-Shoulders pattern can send US Stocks to the 2,820.00 level
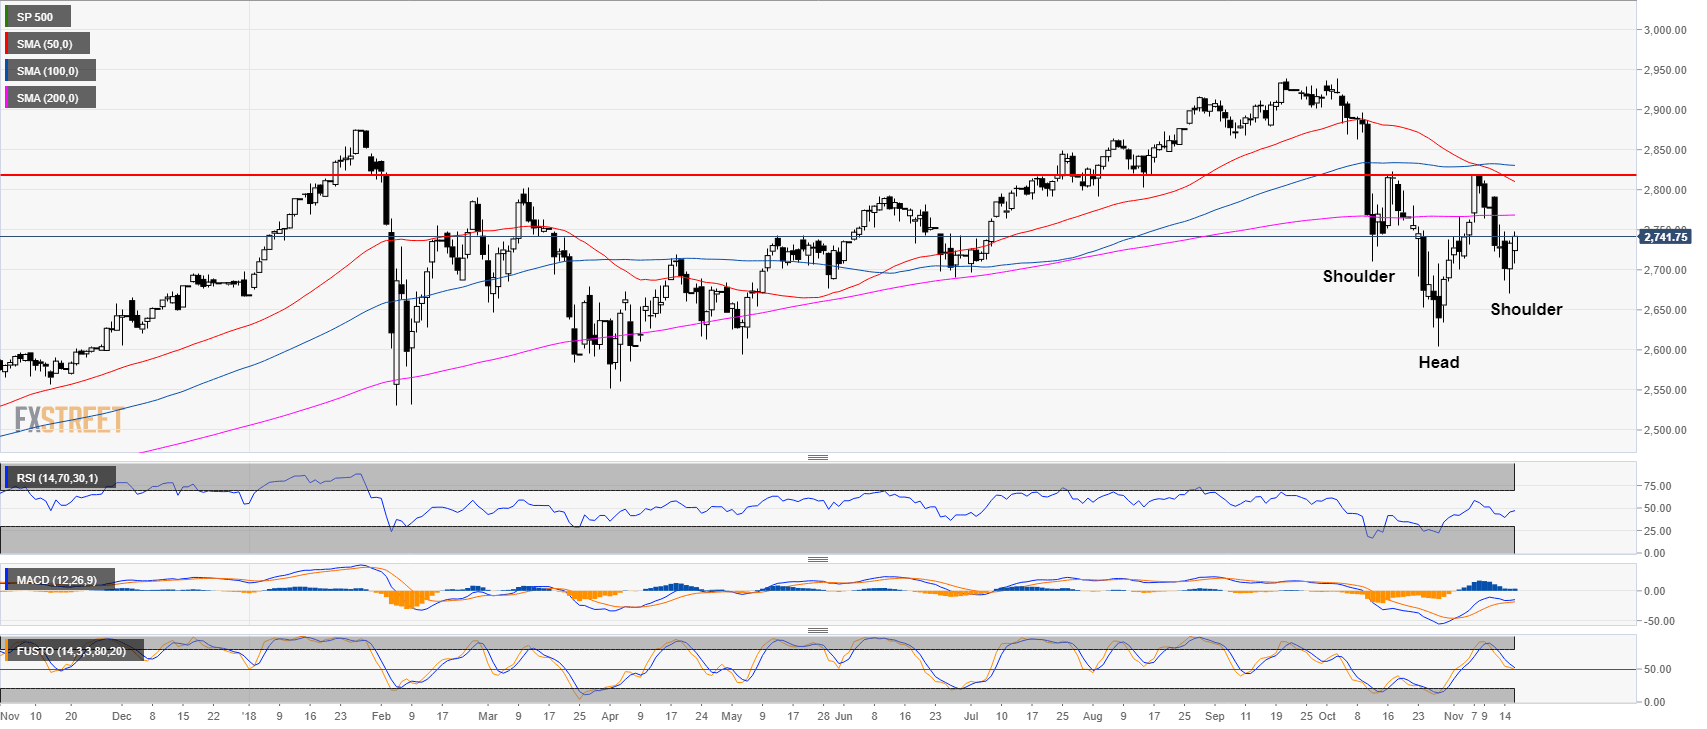
S&P500 daily chart
- The S&P500 printed an inverse head-and-shoulders pattern, which can potentially send the index up in the coming days and weeks.
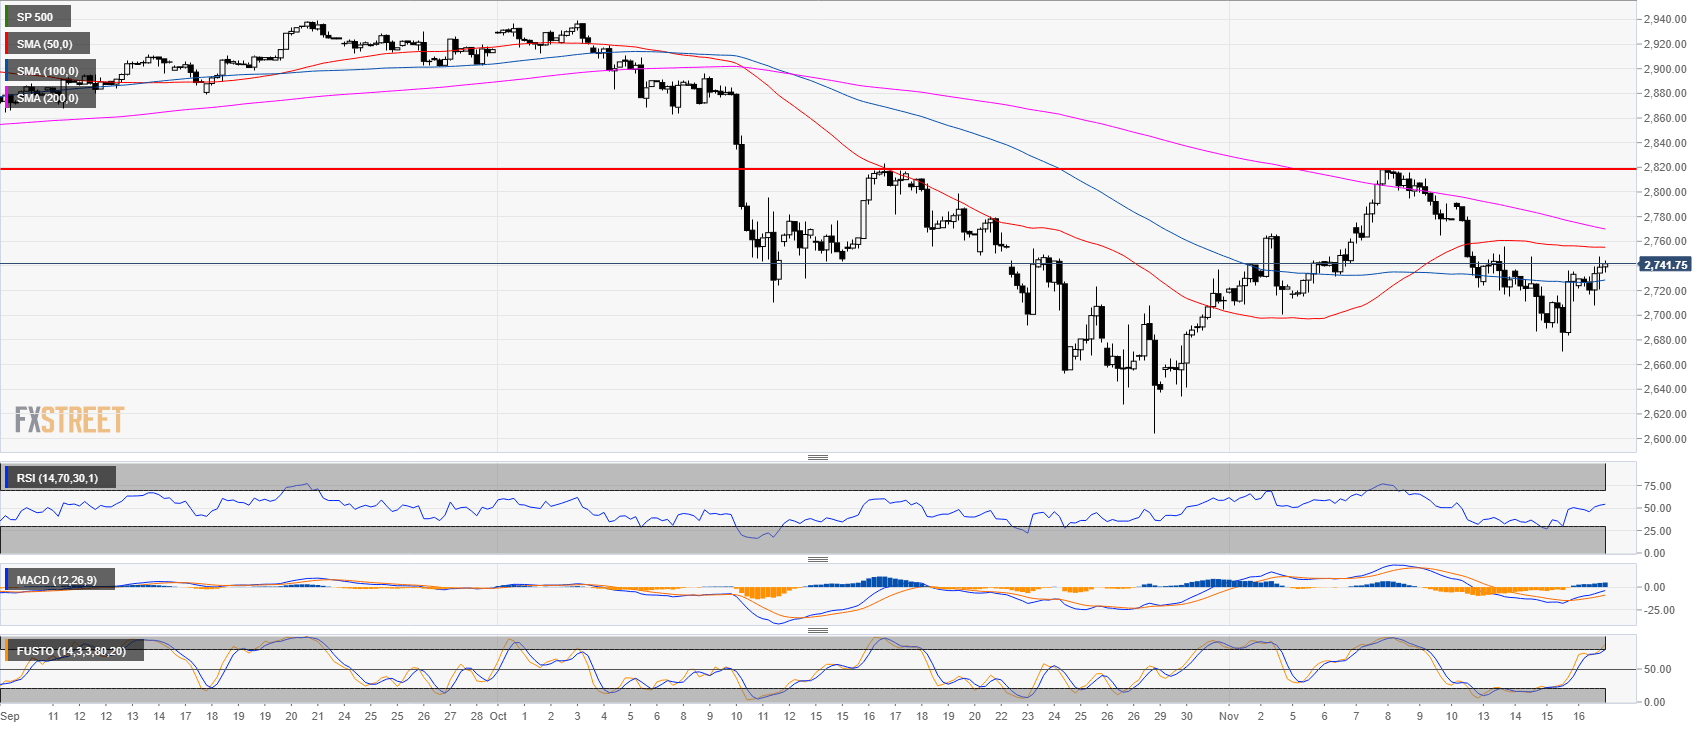
S&P500 4-hour chart
- The S&P500 found strong support at the 2,680.00 level as the bulls reclaimed the 100-period simple moving average (SMA).
- Technical indicators are in positive territories suggesting continued bullish momentum.
- The bull target is at 2,820.00 swing high. A bear breakout below 2,680.00 would invalidate the bullish momentum.
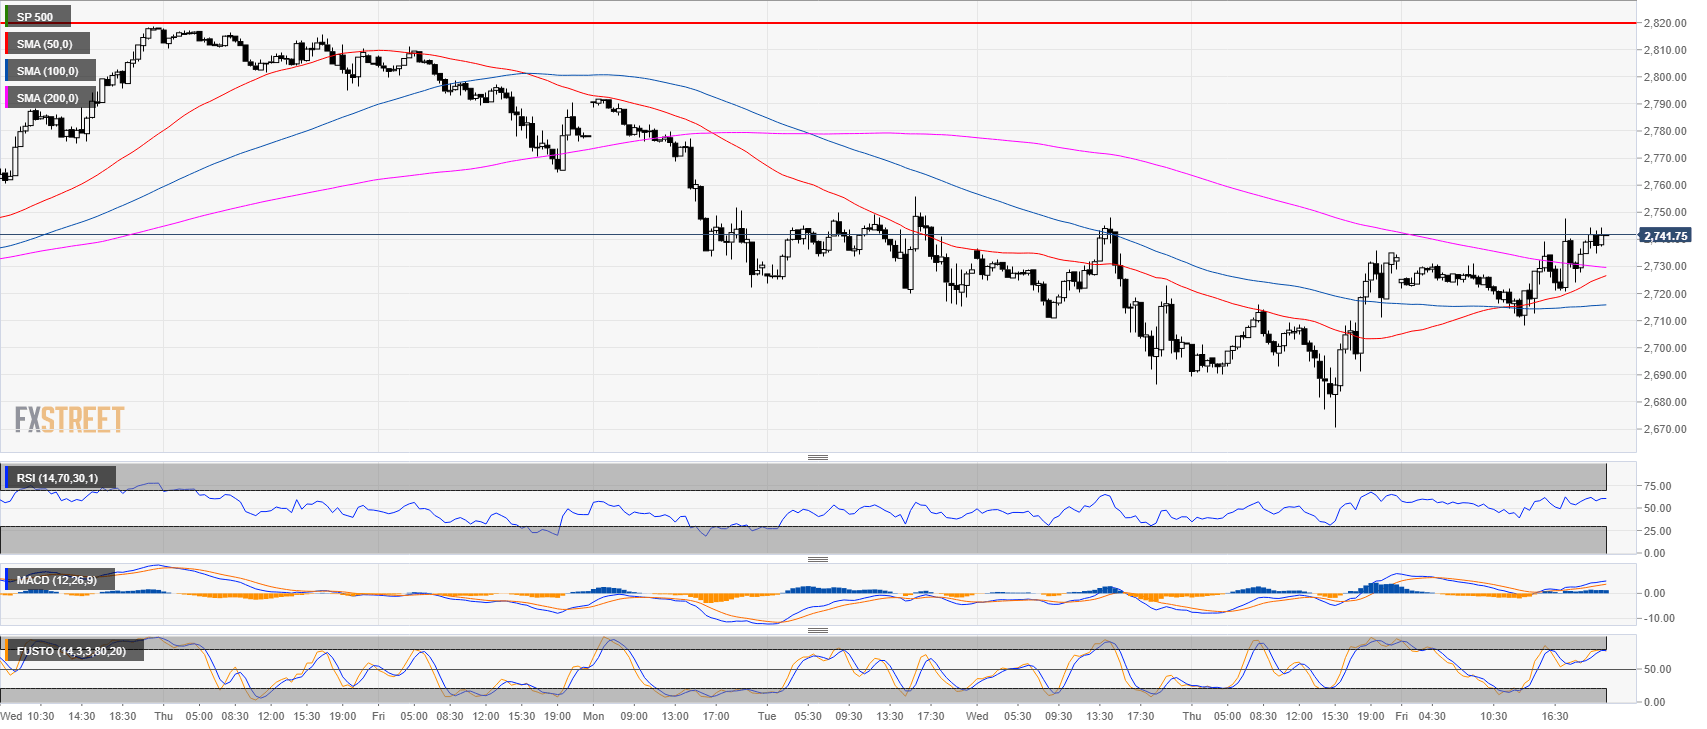
S&P500 30-minute chart
- The market is almost in full bull mode on the 30-minute chart.
- The S&P500 broke above the 50, 100 and 200 SMA while technical indicators are in positive territories.
Additional key levels at a glance:
SP 500
Overview:
Last Price: 2741.75
Daily change: 8.5e+2 pips
Daily change: 0.311%
Daily Open: 2733.25
Trends:
Daily SMA20: 2729.16
Daily SMA50: 2813.38
Daily SMA100: 2830.72
Daily SMA200: 2768.26
Levels:
Daily High: 2736
Daily Low: 2670.75
Weekly High: 2818.75
Weekly Low: 2713.5
Monthly High: 2939.5
Monthly Low: 2604.5
Daily Fibonacci 38.2%: 2711.07
Daily Fibonacci 61.8%: 2695.68
Daily Pivot Point S1: 2690.67
Daily Pivot Point S2: 2648.08
Daily Pivot Point S3: 2625.42
Daily Pivot Point R1: 2755.92
Daily Pivot Point R2: 2778.58
Daily Pivot Point R3: 2821.17