AUD/NZD Technical Analysis: Next leg higher capped by the 55-SMA
- Last week reversal from multi-year intraday lows boosted the pair to levels on top of 1.0600 but then lost strength and pulled back. Still, some positive developments are seen for the Aussie.
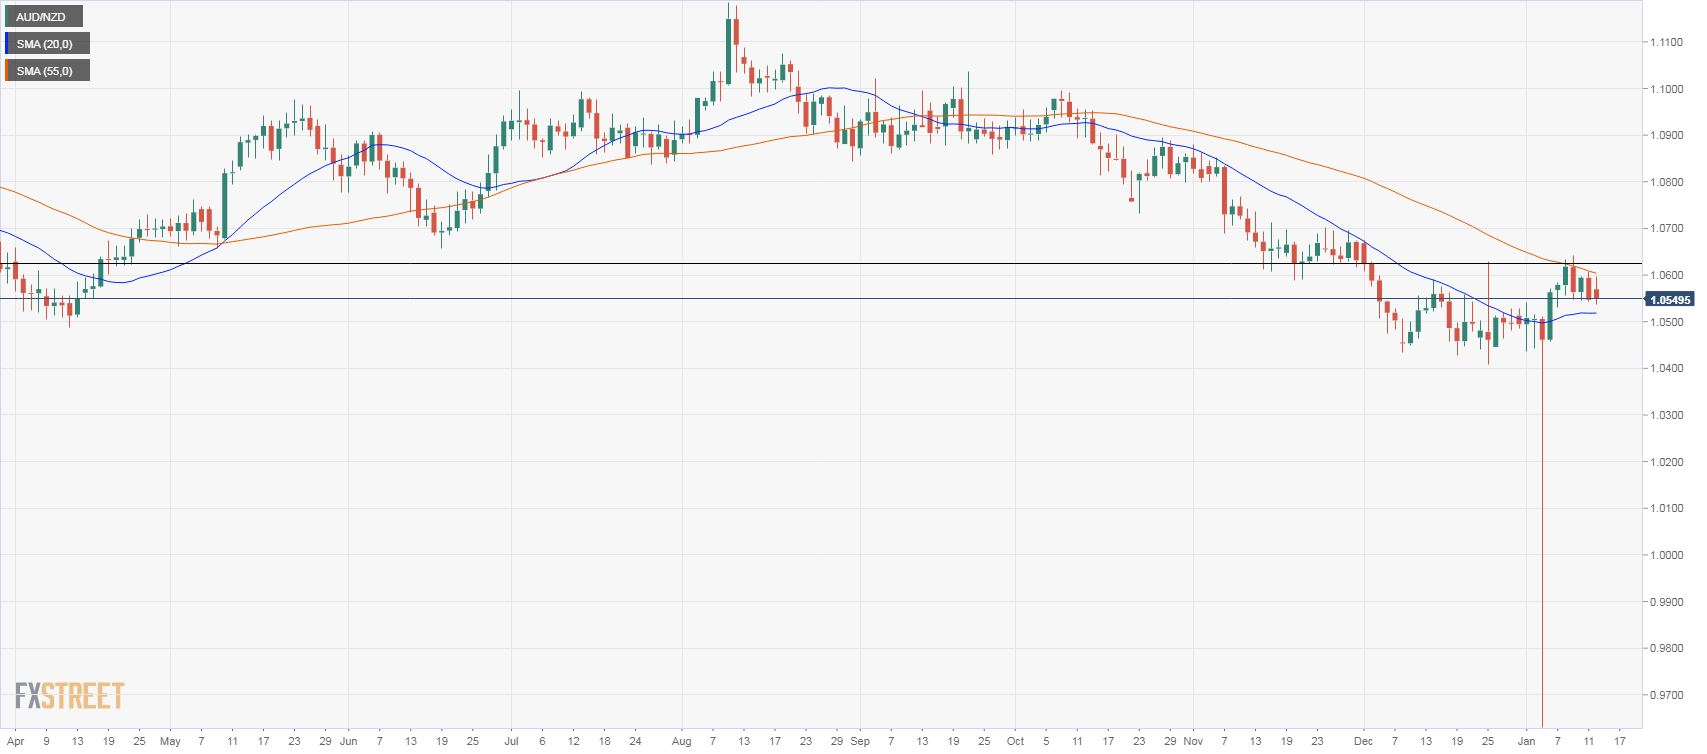
- AUD/NZD has been able to hold above the 20-day moving average at 1.0520/30, the critical support level. A break lower would invalidate the bullish bias. While if it holds above, risks might be tiled to the upside. A break above 1.0610 (horizontal level and 55-SMA) will likely lead to further gains, targeting 1.0680.
- The key support continues to be 1.0450: a consolidation below would open the doors to further losses.
AUD/NZD Daily Chart
AUD/NZD
Overview:
Today Last Price: 1.055
Today Daily change: 3.0 pips
Today Daily change %: 0.0284%
Today Daily Open: 1.0547
Trends:
Previous Daily SMA20: 1.0518
Previous Daily SMA50: 1.0587
Previous Daily SMA100: 1.0743
Previous Daily SMA200: 1.0787
Levels:
Previous Daily High: 1.0608
Previous Daily Low: 1.0542
Previous Weekly High: 1.0641
Previous Weekly Low: 1.0532
Previous Monthly High: 1.0674
Previous Monthly Low: 1.0408
Previous Daily Fibonacci 38.2%: 1.0567
Previous Daily Fibonacci 61.8%: 1.0583
Previous Daily Pivot Point S1: 1.0524
Previous Daily Pivot Point S2: 1.0501
Previous Daily Pivot Point S3: 1.0459
Previous Daily Pivot Point R1: 1.0589
Previous Daily Pivot Point R2: 1.0631
Previous Daily Pivot Point R3: 1.0654