Back
20 Jun 2019
US Dollar Index technical analysis: DXY down and challenging a critical level at 96.46
- The greenback is under pressure for the second consecutive day.
- The level to beat for bears is at 96.46.
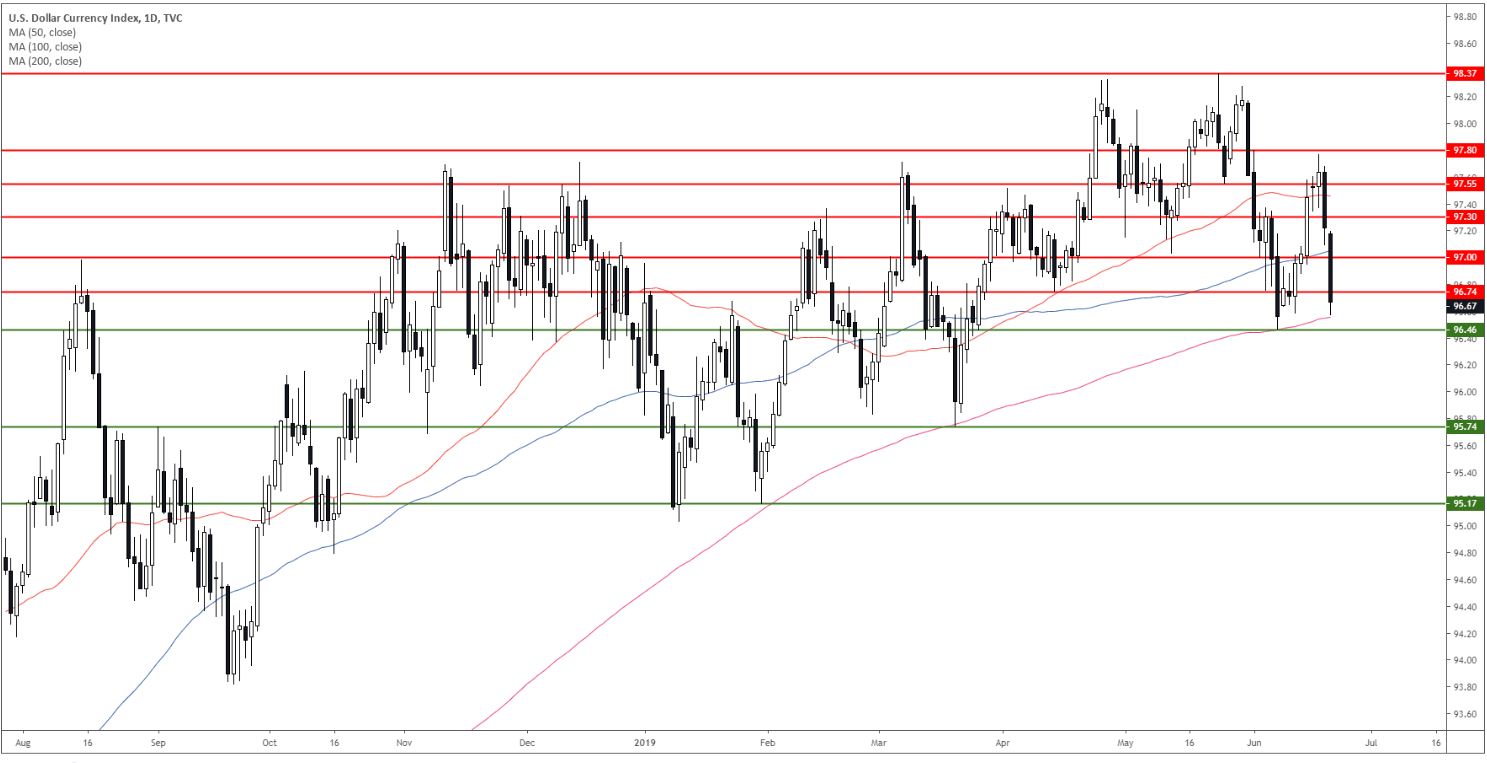
DXY daily chart
The US Dollar Index (DXY) is in a bull trend above its 100 and 200-day simple moving averages (DSMA). The market went down sharply this Thursday but found some support just above the 96.46 support and the 200 SMA.
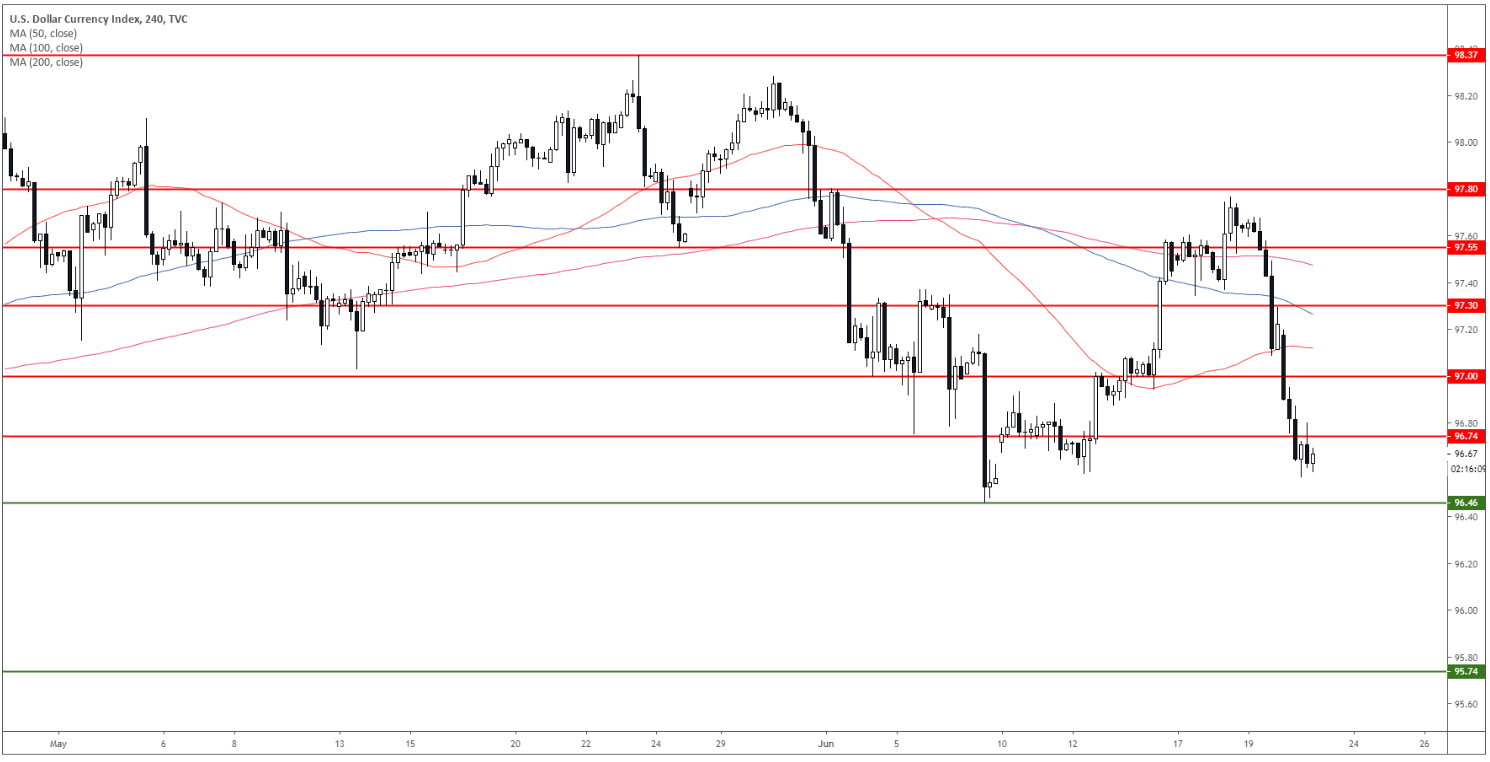
DXY 4-hour chart
DXY broke below the 97.74 level and the main SMAs. If the greenback breaks below 96.46 key support the market could collapse to the 95.74 level.
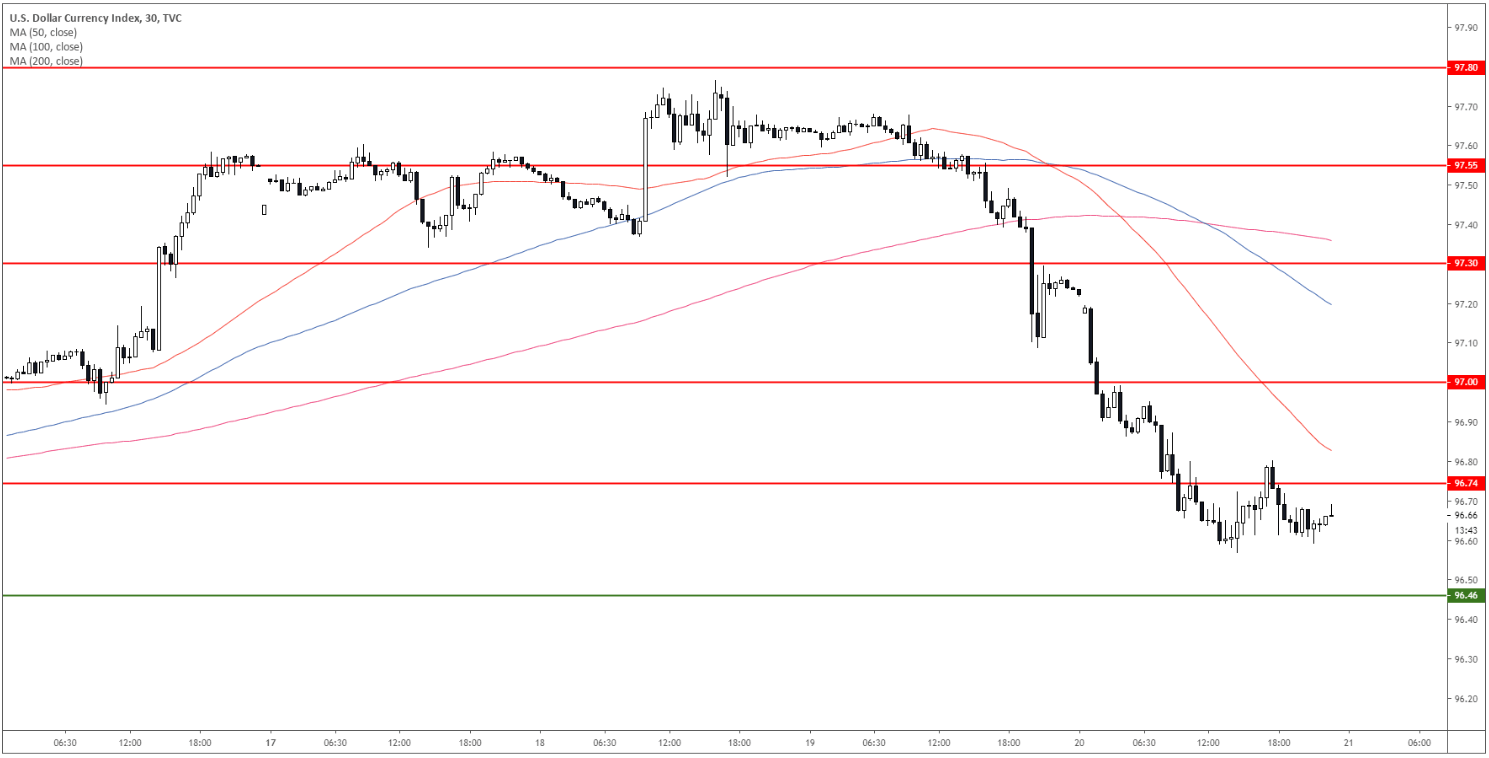
DXY 30-minute chart
DXY is trading below 97.30 and its main SMAs suggesting bearish momentum in the near term. The 50 and 100 SMA crossed below the 200 SMA which is a bearish sign. Resistance is seen at 96.74 and 97.00.
Additional key levels