Back
25 Jul 2019
US Dollar Index technical analysis: DXY battling with the 97.80 resistance at July tops
- DXY tried to break above 97.80 but is currently finding no clear acceptance above that level.
- The levels to beat for bulls are seen at 97.80 and 98.38 (2019 high).
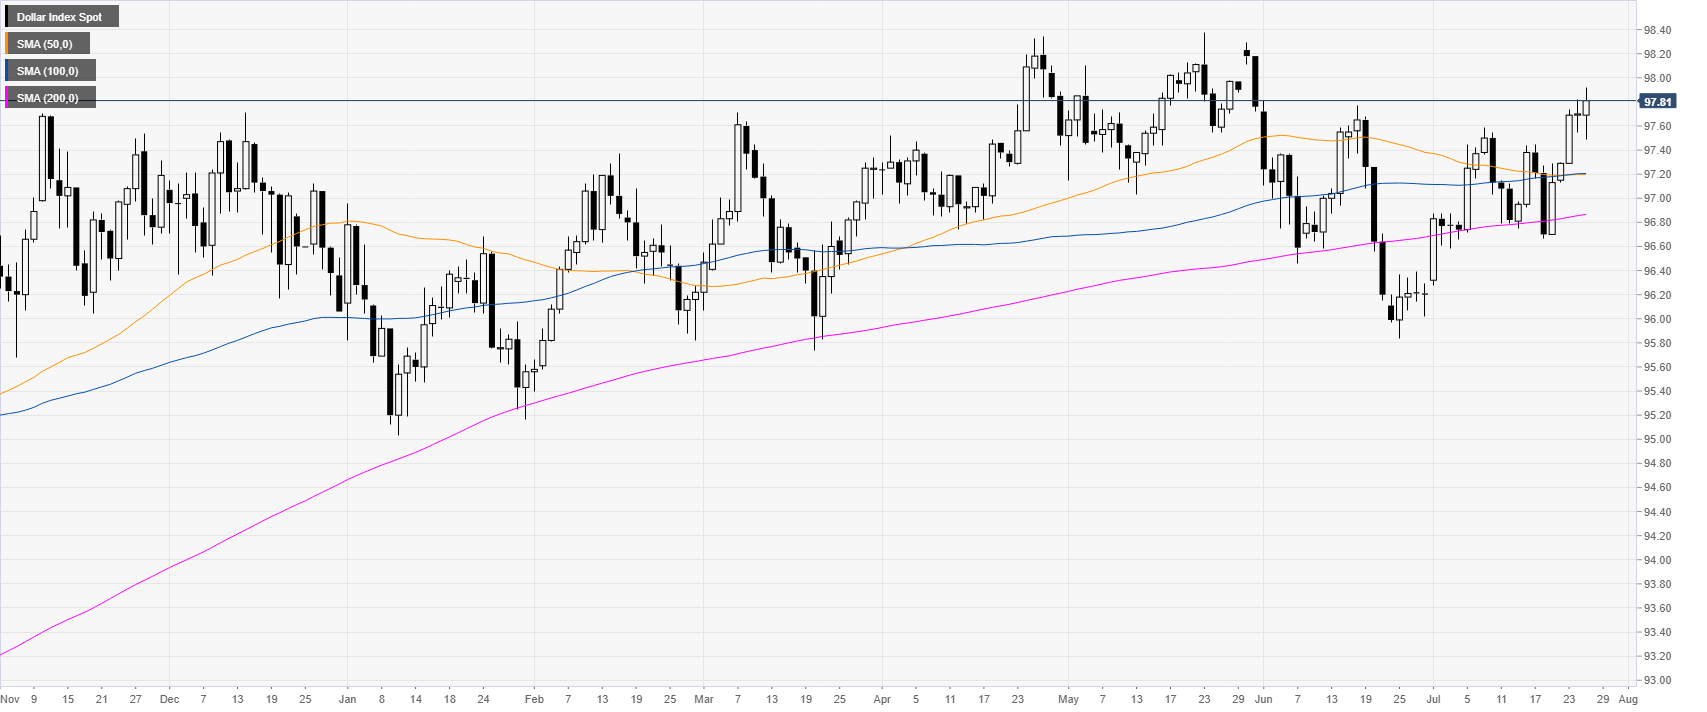
DXY daily chart
The market is trading in a bull trend above the main daily simple moving averages (DSMAs) as well as the 97.55 support.
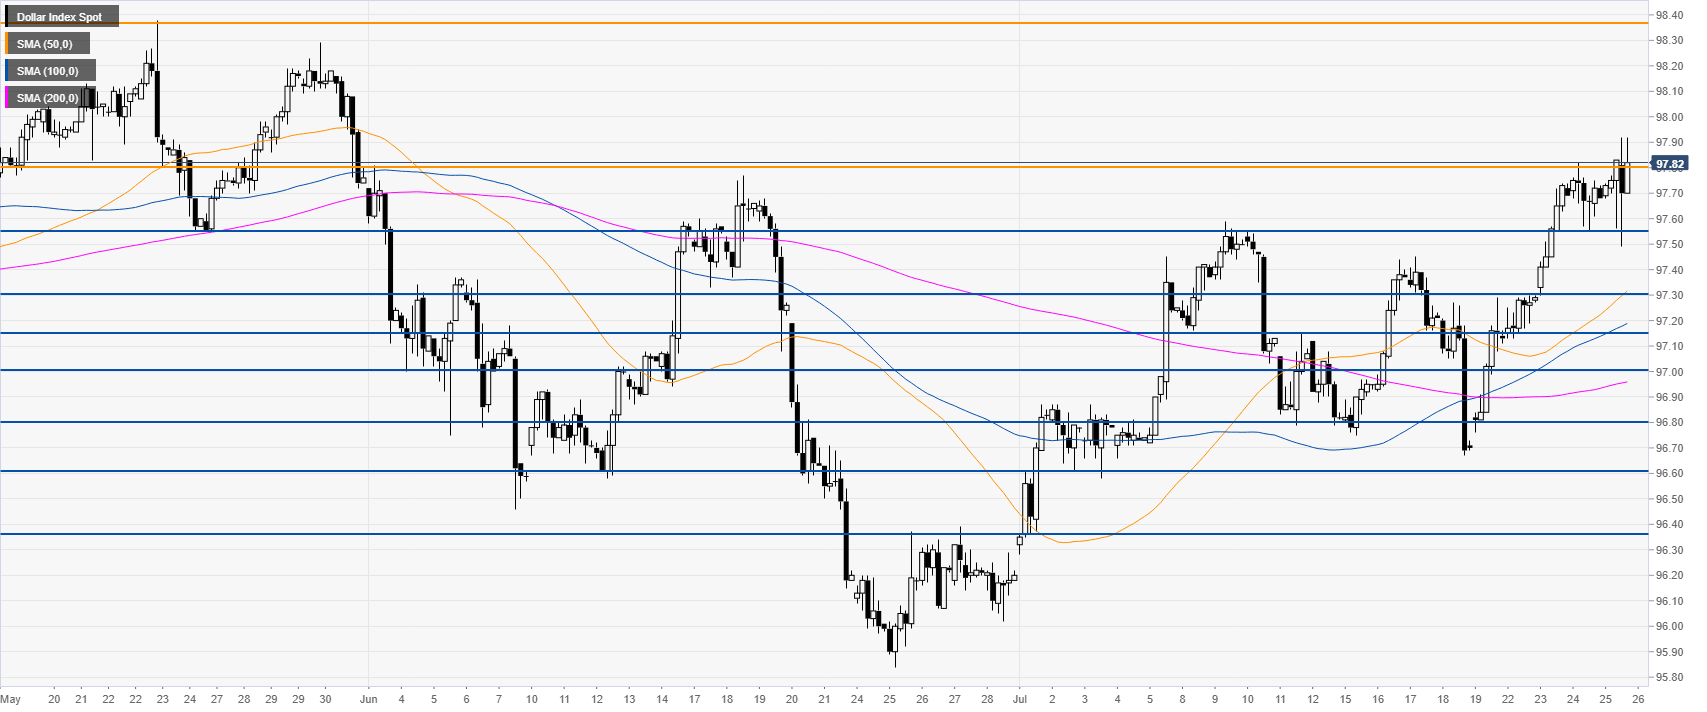
DXY 4-hour chart
DXY is challenging the 97.80 resistance level as it is trading above the main SMAs. A clear break above the level is needed for the market to reach the 2019 high near 98.38. Immediate support is seen at the 97.55 and 97.30 levels.
Additional key levels