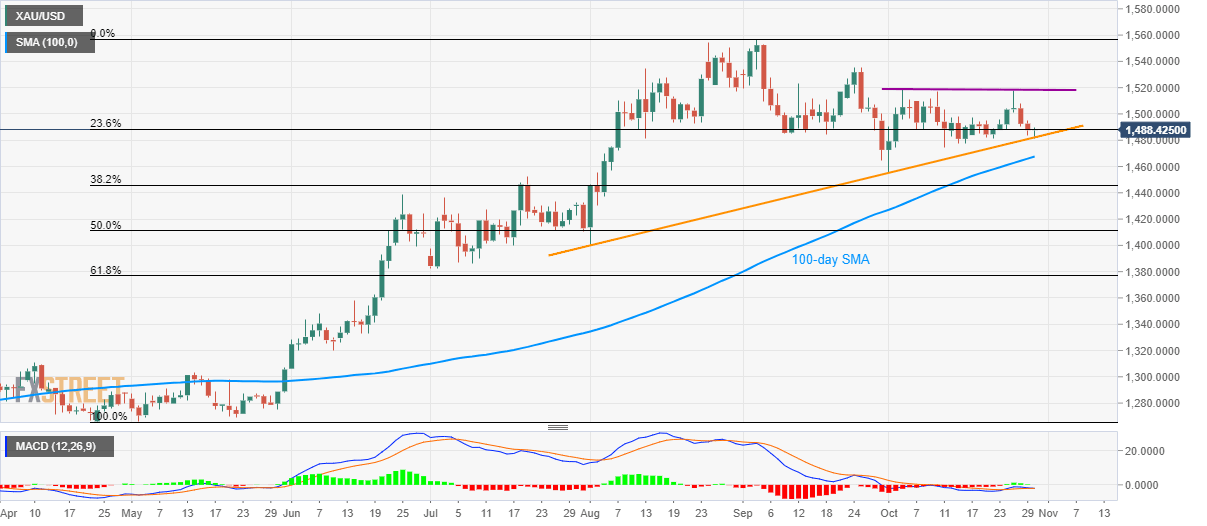
Gold technical analysis: Bounces off three-month-old rising trendline
- Gold clings to 23.6% Fibonacci retracement after a bounce from a multi-week-old support line.
- 100-day SMA could challenge sellers targeting July top, $1,518/20 area seems to restrict immediate upside.
With the recent trade/political headlines renewing risk aversion, Gold prices take a U-turn from a three-month-old ascending support line while taking the bids to $1,489 amid Wednesday’s Asian session.
Considering the bullish signals from 12-bar Moving Average Convergence and Divergence (MACD) and the recent run for risk safety, gold is heading towards $1,500 round-figure prior to challenging a four-week long horizontal barrier, around $1,518/20.
In a case where the quote manages to cross $1,520 on a daily (D1) closing basis, $1,535 and September month top close to $1,557 will grab the buyer’s attention.
On the contrary, pair’s declines below the key support line on a D1 basis, at $1,482 now, will highlight 100-day Simple Moving Average (SMA) as the next important support, near $1,467, while July month high around $1,453/52 could lure bears then after.
Gold daily chart

Trend: pullback expected
