AUD/JPY Price Analysis: Inside weekly falling channel below 200-hour SMA
- AUD/JPY remains under pressure since last Thursday.
- 61.8% of Fibonacci retracement can question bears below the channel’s downside break.
- The bulls can target the monthly top on the break of 200-hour SMA.
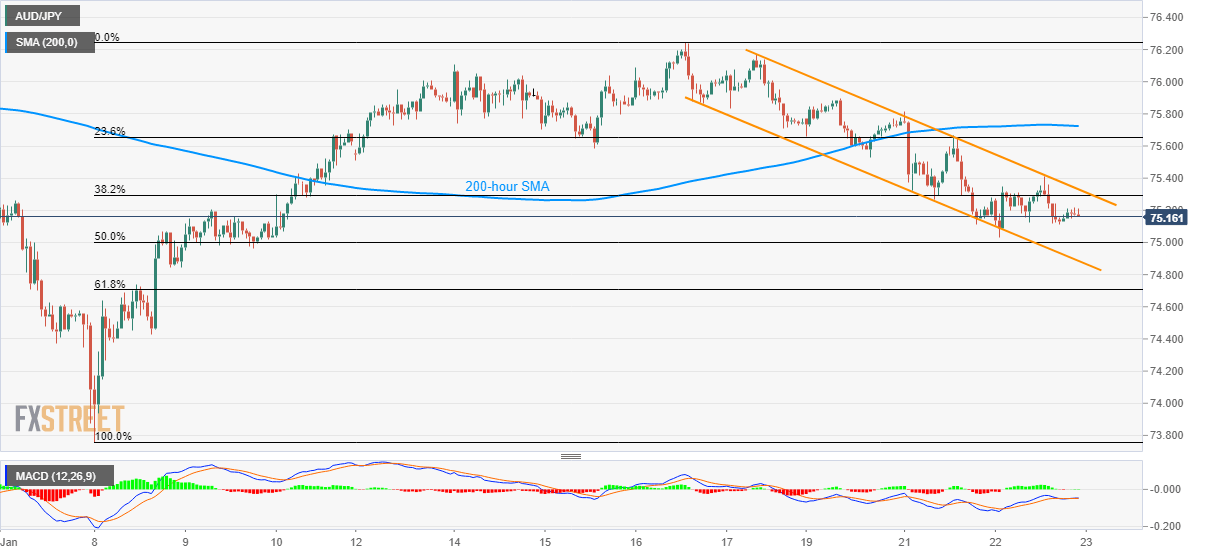
AUD/JPY fails to hold on to recovery gains while declining to 75.20 during the early Thursday morning in Asia. The pair portrays a bearish channel formation below 200-hour SMA on the charts.
As a result, the quote’s lower grind to 50% Fibonacci retracement of the pair’s January 08-16 upside, at 75.00, becomes imminent. However, the channel’s support-line near 74.89 could restrict further downside of the pair.
In a case where the sellers defy channel formation, 61.8% Fibonacci retracement level surrounding 74.70 can challenge the bears ahead of pleasing them with 74.40 and 74.00 numbers to the south.
Meanwhile, an upside clearance of the channel’s resistance line, at 75.33 now, can push the AUD/JPY prices towards a 200-hour SMA level of 75.75.
Also, a sustained run-up beyond 75.75 enables the bulls to target highs marked on January 16 and 01, around 76.25 and 76.35 respectively, during the extended rise.
AUD/JPY hourly chart
Trend: Bearish