Back
25 Mar 2020
USD/CHF Price Analysis: Bears aim for monthly trendline below 200-day SMA
- USD/CHF remains on the back foot following its failure to sustain the break of 200-day SMA.
- A confluence of 50% Fibonacci retracement, 21-day SMA offers strong support.
- Bulls will seek entry above 0.9900.
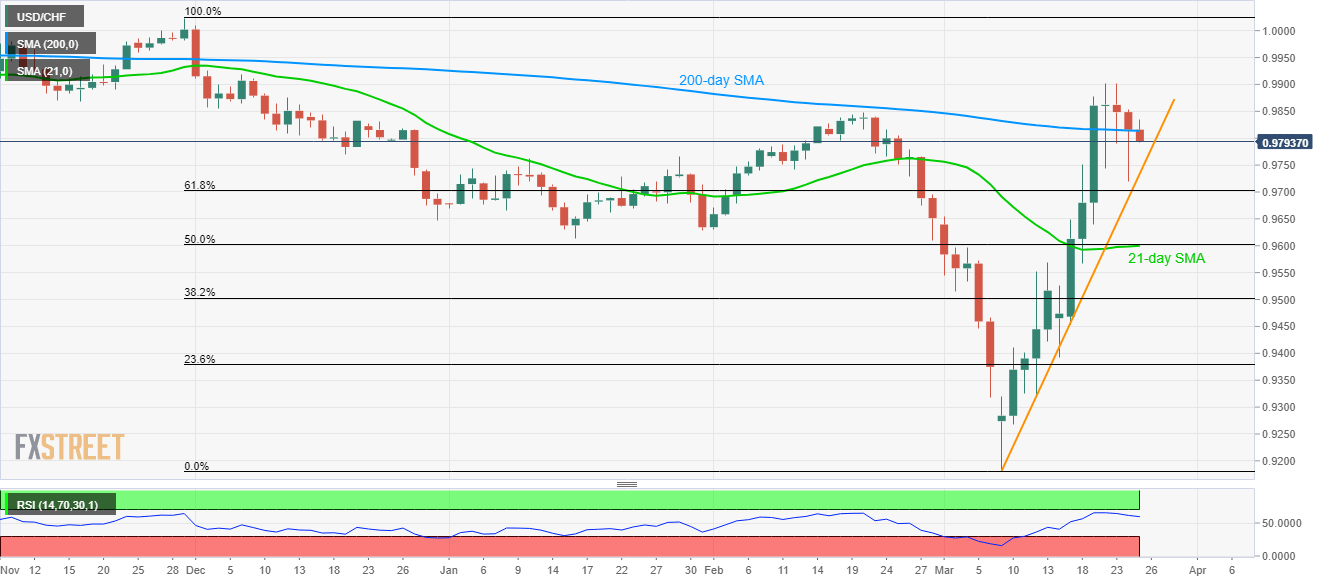
Having failed to extend its run-up beyond 200-day SMA, USD/CHF drops to 0.9790, down 0.25%, amid the early trading hours of Wednesday.
As a result, the quote currently drops towards an upward sloping trend line from March 03, near 0.9735, ahead of testing 61.8% Fibonacci retracement of November 2019 to March 2020 fall, around 0.9700.
However, a confluence of 21-day SMA and 50% Fibonacci retracement near 0.9600 could limit the pair’s further downside.
On the upside, 200-day SMA offers immediate resistance near 0.9815, a break of which can recall 0.9900 mark.
During the pair’s sustained rise above 0.9900, November 2019 top close to 1.0025 will be in focus.
USD/CHF daily chart
Trend: Pullback expected