S&P 500 Futures Price Analysis: Bulls eye $3315/20 amid rounding bottom breakout
- The path of least resistance appears to the upside.
- Rounding bottom breakout spotted on the hourly chart.
- Upturn in S&P 500 futures points to positive Wall Street open.
S&P 500 futures, the risk barometer, has flipped to gains in the European session, shrugging-off the US-China escalation over the Houston consulate, as the bulls ride higher on the global stimulus wave.
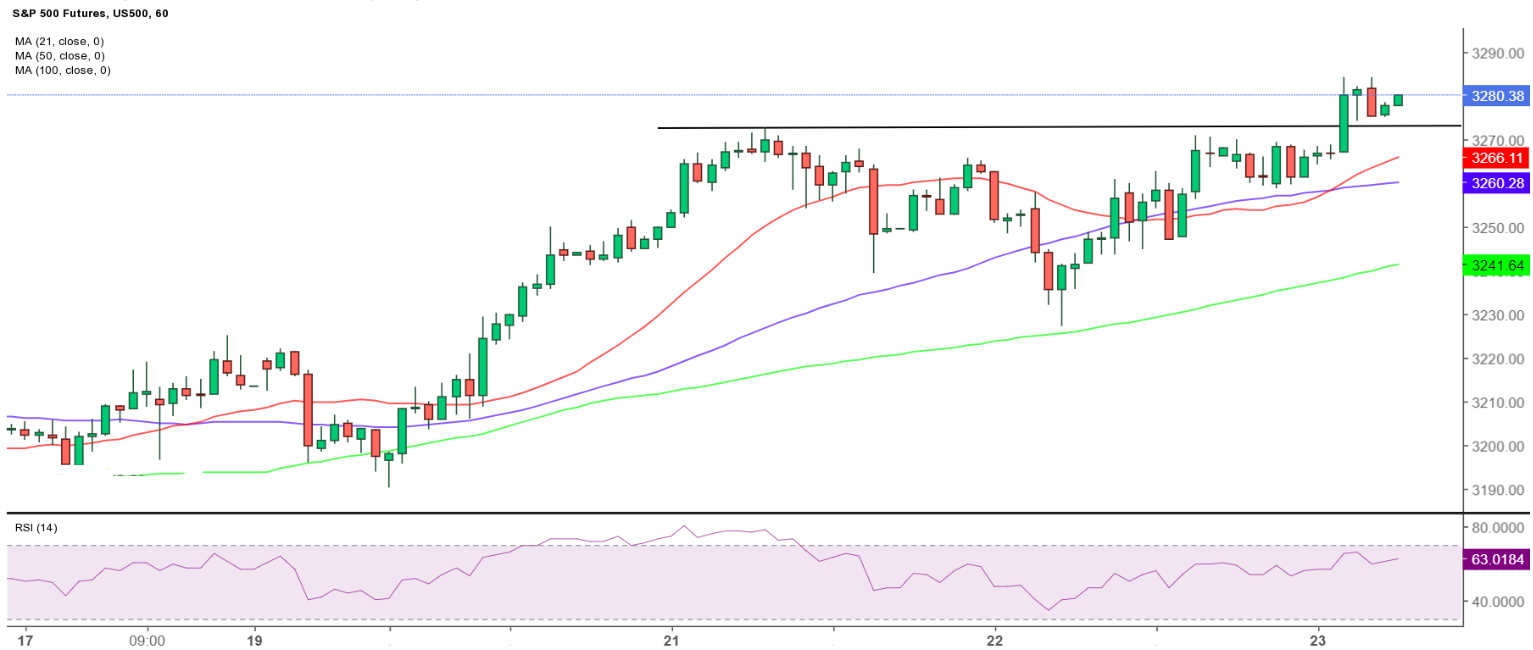
From a technical perspective, the price has charted a rounding bottom breakout on the hourly sticks a couple of hours ago, following a break above the 3273 level, where the horizontal trendline resistance and Tuesday’s high coincide.
The 21-hourly Simple Moving Average (HMA) crossing above the 50-HMA back then, likely triggered the bullish break in the US futures.
With the bulls in complete control, the next upside target is seen at the 3300 psychological level. Acceptance above the latter will open doors towards the pattern target of $3318.
The hourly Relative Strength Index (RSI) inches higher at 60.50, suggesting a more upward room.
On the flip side, the immediate support is aligned at the earlier key resistance-turned-support at 3273.
Sellers would eye the bullish 21-HMA support at 3265 if that powerful support caves in. Further down, 3260 will be the next cushion. The 50-HMA lies at that level.
All in all, the current brief consolidative stint suggests that the bulls are gearing up for the next leg higher.
S&P 500 Futures: Hourly chart