US Dollar Index Price Analysis: Teases immediate rising wedge confirmation
- DXY stays on the back foot around weekly lows.
- Sustained trading below 50-day SMA, bearish chart formation keeps greenback sellers hopeful.
- 21-day SMA probes short-term downside ahead of the monthly low.
US dollar index (DXY) fades the bounce off 90.40 while taking rounds to 90.50 during Wednesday’s Asian session. The greenback gauge versus major currencies marked the heaviest losses in over a week the previous day while extending pullback from the monthly top, portrayed on Monday. In doing so, DXY teases confirmation of a short-term rising wedge, bearish chart play.
Given the greenback gauge’s inability to cross 50-day SMA, coupled with expected risk-on mood, DXY is likely to confirm the bearish pattern.
Although USD bears an eye for the fresh multi-month low following the DXY declines below 90.45, 21-day SMA near 90.15 and the 90.00 threshold can offer intermediate halts during the fall.
Meanwhile, an upside clearance of 50-day SMA, at 90.87 now, needs to defy the bearish chart play by crossing the pattern’s resistance line around 91.00.
Following that, DXY bulls will eye for December 07 top near 91.25 and September 2020 low near 91.75 ahead of challenging the 92.00 round-figure.
DXY daily chart
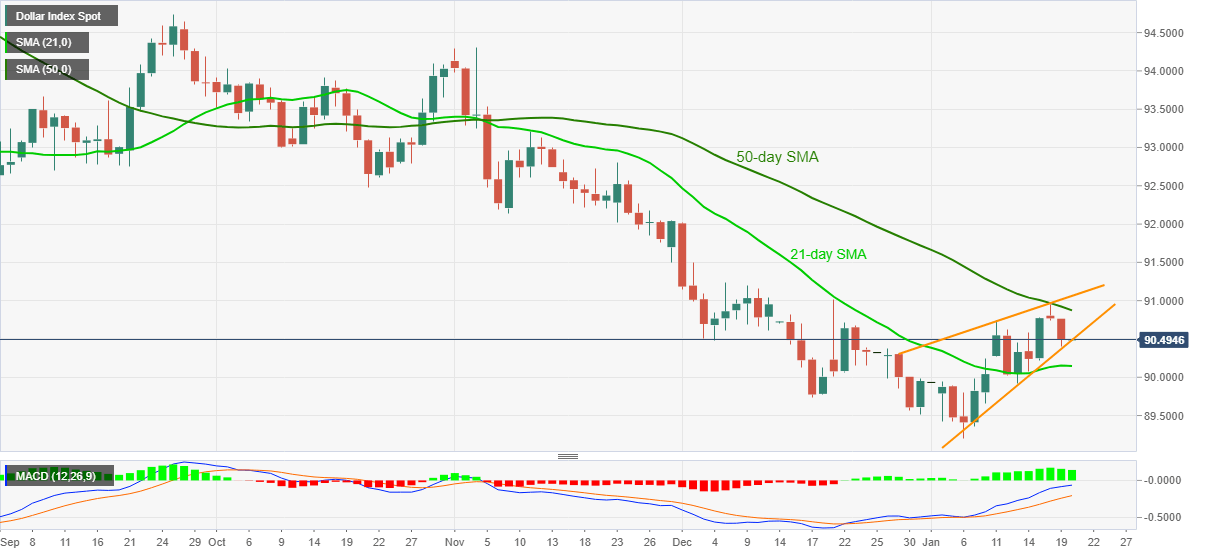
Trend: Bearish