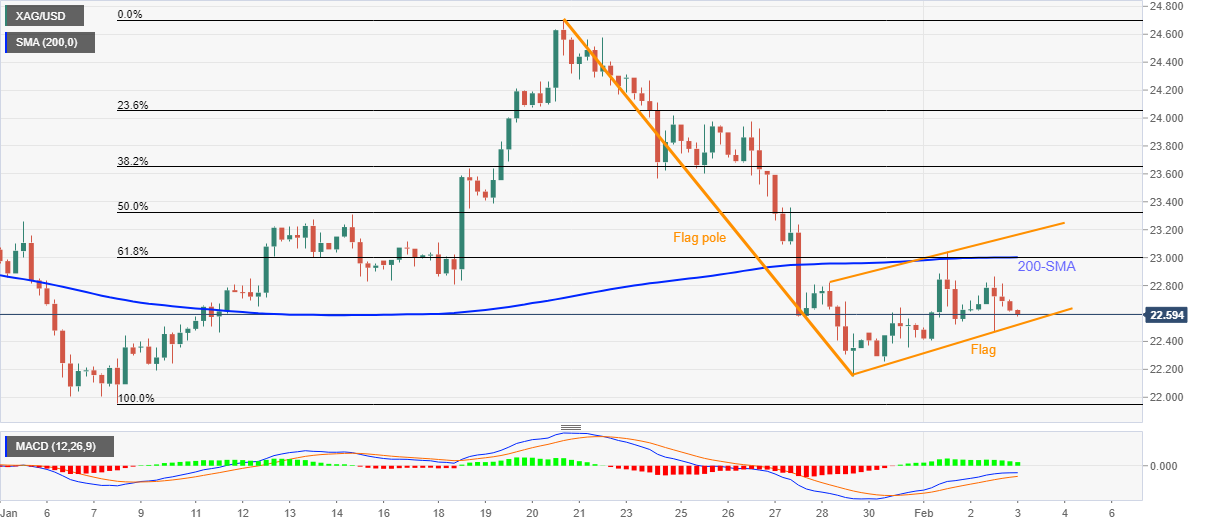
Silver Price Analysis: XAG/USD prints bear flag on 4H, $22.50 is the key
- Silver remains on the back foot inside a bearish chart pattern, snaps three-day uptrend.
- Failures to cross 200-SMA, 61.8% Fibonacci retracement keep sellers hopeful.
Silver (XAG/USD) refreshes intraday low around $22.60, 0.31% on a day during early Thursday.
In doing so, the bright metal portrays daily loss for the first time in four while staying inside a bearish flag chart pattern.
That said, the metal’s sustained trading below 200-SMA and 61.8% Fibonacci retracement (Fibo.) of January 07-20 upside, near $23.00, also keep sellers hopeful.
However, a clear downside break of the $22.50 becomes necessary to confirm the theoretical fall targeting the $20.00 threshold. During the fall, the last month’s low near $21.95 and December 2021 bottom surrounding $21.40 may act as intermediate halts.
Alternatively, a daily closing beyond $23.00 isn’t enough to convince silver buyers as the upper line of the stated flag will challenge the run-up near $23.15.
Following that, the 50.0% Fibo. surrounding $23.35 may test XAG/USD bulls before giving them control.
Silver: Four-hour chart

Trend: Further weakness expected
