Gold Price Forecast: XAU/USD bulls need acceptance beyond $1,645 – Confluence Detector
- Gold price rebounds from two-year low as risk-aversion ebbs amid sluggish markets.
- Softer yields, US inflation expectations underpin XAU/USD’s corrective bounce.
- Sustained trading beyond $1,645 appears necessary for bulls to keep reins.
Gold price (XAU/USD) extends bounce off a 29-month low as buyers cheer the US dollar pullback near $1,635 during early Tuesday. That said, the US Dollar Index (DXY) retreats from the 20-year high, down 0.40% intraday near 113.68 by the press time, as softer yields join downbeat US data and inflation expectations. Also adding strength to the XAU/USD rebound could be the market’s hope of central bank intervention, considering the latest moves from the Bank of Japan (BOJ) and the People’s Bank of China (PBOC). Additionally, Germany’s capacity to channel more fuel for winter and the Fed policymakers’ fears of defending the US dollar amid the meddling from the other central banks also propel the gold prices, via the US dollar’s weakness.
That said, the speech from US Fed Chairman Jerome Powell and the US data comprising CB Consumer Confidence for September and Durable Goods Orders for August will be important for immediate direction. Also, headlines from the UK and concerning recession could offer additional hints to the XAU/USD traders.
Also read: Gold Price Forecast: XAU/USD seems poised to break below $1,600 amid Fed rate hike jitters
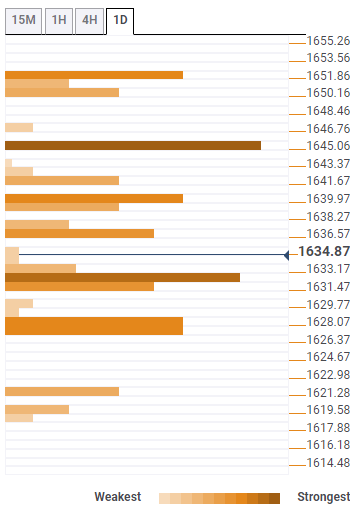
Gold Price: Key levels to watch
The Technical Confluence Detector shows that the gold price approaches the $1,646 resistance confluence comprising the middle band of the hourly Bollinger and the pivot point one month S2.
That said, a convergence of the previous week’s low and Fibonacci 61.8% on one day restricts immediate upside near the $1,640 mark.
It should also be noted that Fibonacci 23.6% on one week, around $1,652, acts as the last defense for the XAU/USD bears.
On the contrary, the middle band of the hourly Bollinger, Fibonacci 38.2% one-day and SMA5 4H high $1,631 as the immediate support.
Following that, the previous low on the 4H joins the Fibonacci 23.6% one-day to highlight the $1,627 as the key support.
Overall, gold is likely to remain weak unless staying successfully beyond $1,645.
Here is how it looks on the tool
About Technical Confluences Detector
The TCD (Technical Confluences Detector) is a tool to locate and point out those price levels where there is a congestion of indicators, moving averages, Fibonacci levels, Pivot Points, etc. If you are a short-term trader, you will find entry points for counter-trend strategies and hunt a few points at a time. If you are a medium-to-long-term trader, this tool will allow you to know in advance the price levels where a medium-to-long-term trend may stop and rest, where to unwind positions, or where to increase your position size.